Did Pay Keep Up With the Pump? How the 2026 Gas Shock Reached Frontline Shift Fill
Did Pay Keep Up With the Pump? How the 2026 Gas Shock Reached Frontline Shift Fill
Did Pay Keep Up With the Pump? How the 2026 Gas Shock Reached Frontline Shift Fill
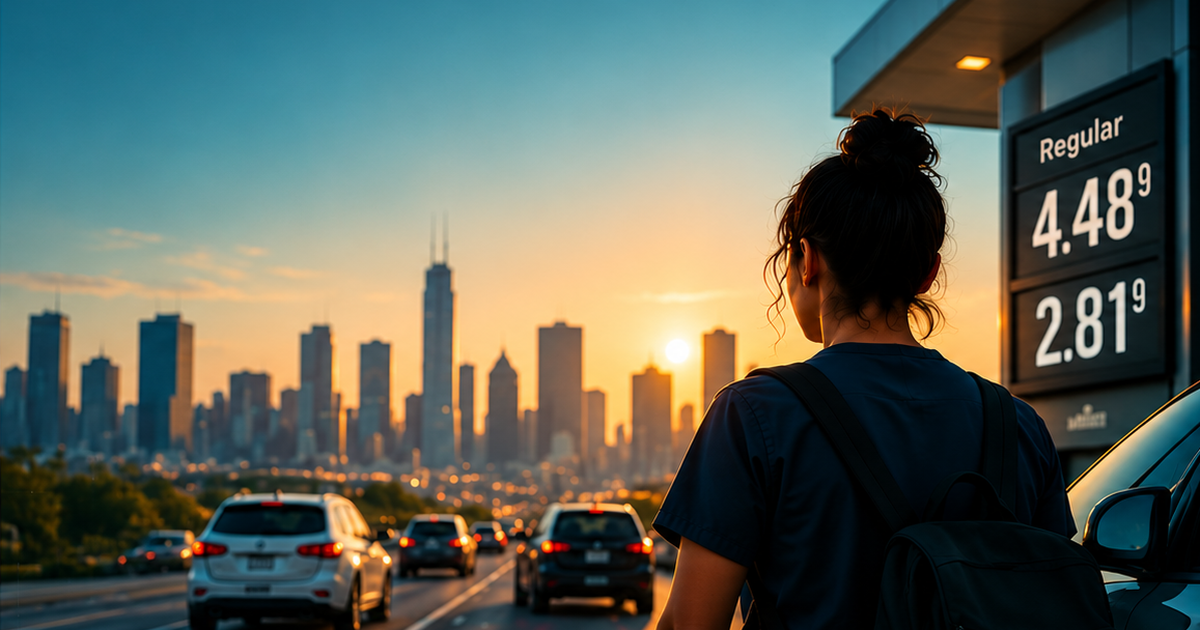
When gas prices jump, the cost of getting to work rises with every mile driven. For hourly frontline workers, many of whom drive to shifts, a commute is an unpaid expense that comes straight out of take-home pay. This post uses WorkWhile shift data to ask how the 2026 fuel shock changed workers' willingness to take on distant shifts, and whether incentive pay adjusted to make up the difference.
A commute is a pay cut nobody negotiates
Discussions of wages usually start from the posted rate: what a shift pays per hour. For a worker deciding whether to accept a shift, though, the number that matters is what's left after the cost of getting there. Since most frontline work can't be done remotely, every shift involves a trip, and every mile of that trip has a cost that rises and falls with the price of fuel.
This makes distance a pricing problem. When gas is cheap, a shift 40 miles away and one 20 miles away might feel similar. When gas is expensive, the farther shift is effectively worth less. A labor market works well only if pay adjusts for that gap. If it doesn't, the shifts farthest from where workers live are the ones that go unfilled.
The 2026 run-up in gasoline prices was a rare natural experiment for measuring this. We asked two questions:
- Did distance become a bigger barrier to filling shifts after gas prices spiked?
- Did incentive pay (bonuses) for distant shifts rise to offset higher fuel costs?
2026: a large and lasting fuel shock
The U.S. average price of regular gasoline went from $2.81 per gallon in January 2026 to $4.48 in May, a 59% increase in four months. Prices eased over the summer but stayed far above where they began the year, then climbed again in September to about $4.35, 55% higher than in January. This was not a brief spike that faded before workers had to adjust. It was a sustained increase in what it costs to get to work.
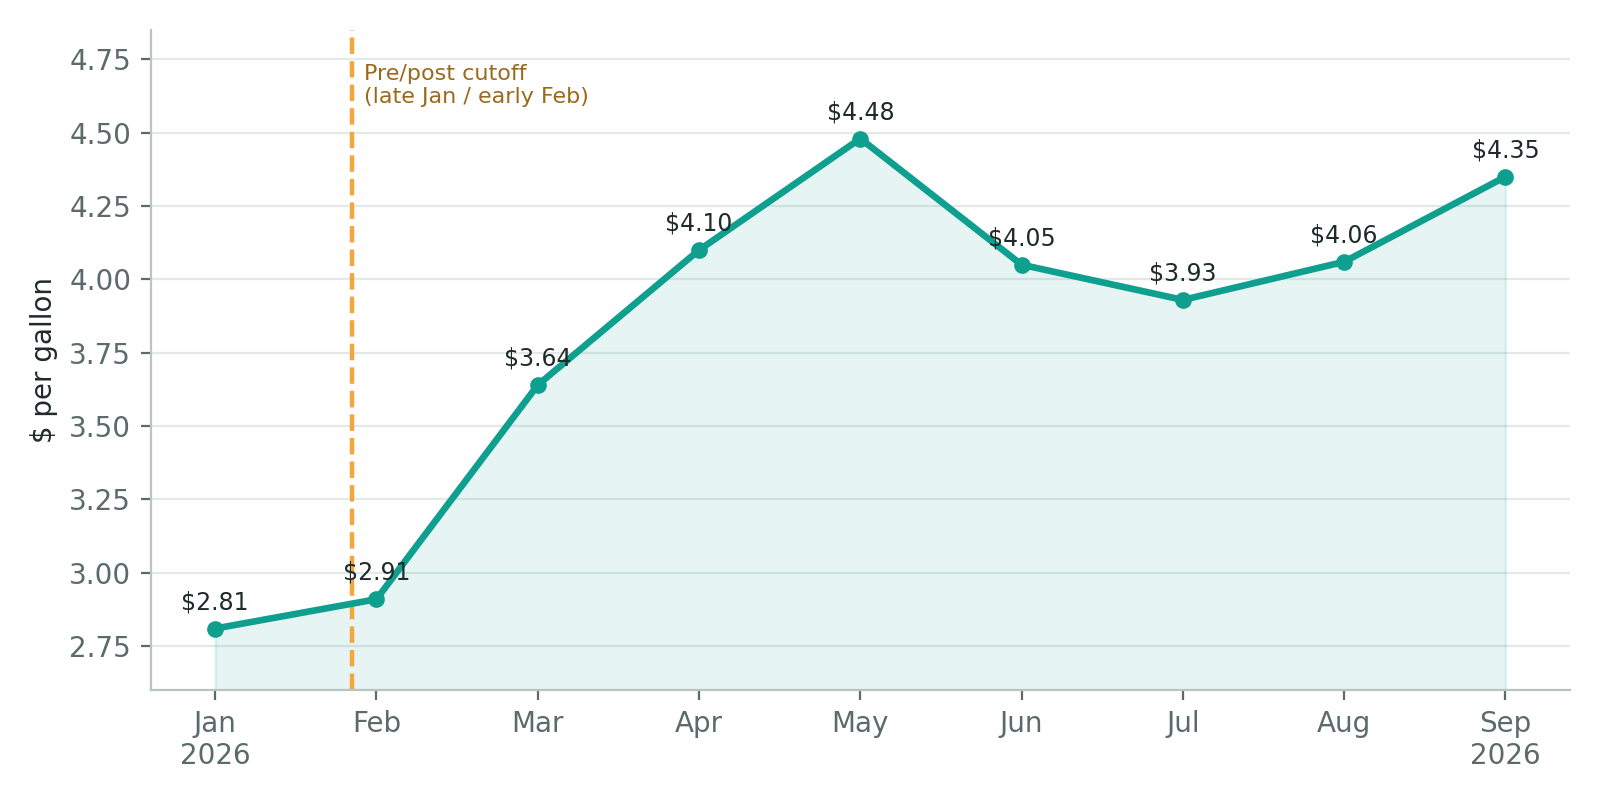
Figure 1: U.S. regular gasoline, monthly average price, January to September 2026. Source: U.S. Energy Information Administration (EIA), retail price of regular gasoline, all formulations. September is the average of EIA's four weekly September readings. The dashed line marks the pre/post cutoff used in our analysis.
Distance is how the shock reaches the shift
Most WorkWhile shifts are fairly close to the workers who take them. The distribution of average worker-to-shift distance is centered in the low-to-mid 20s of miles, and the overall mean is 31.5 miles. The right tail is long, though: a meaningful share of shifts sit 40 to 60 miles away or more. Those distant shifts are the ones a fuel shock affects most.
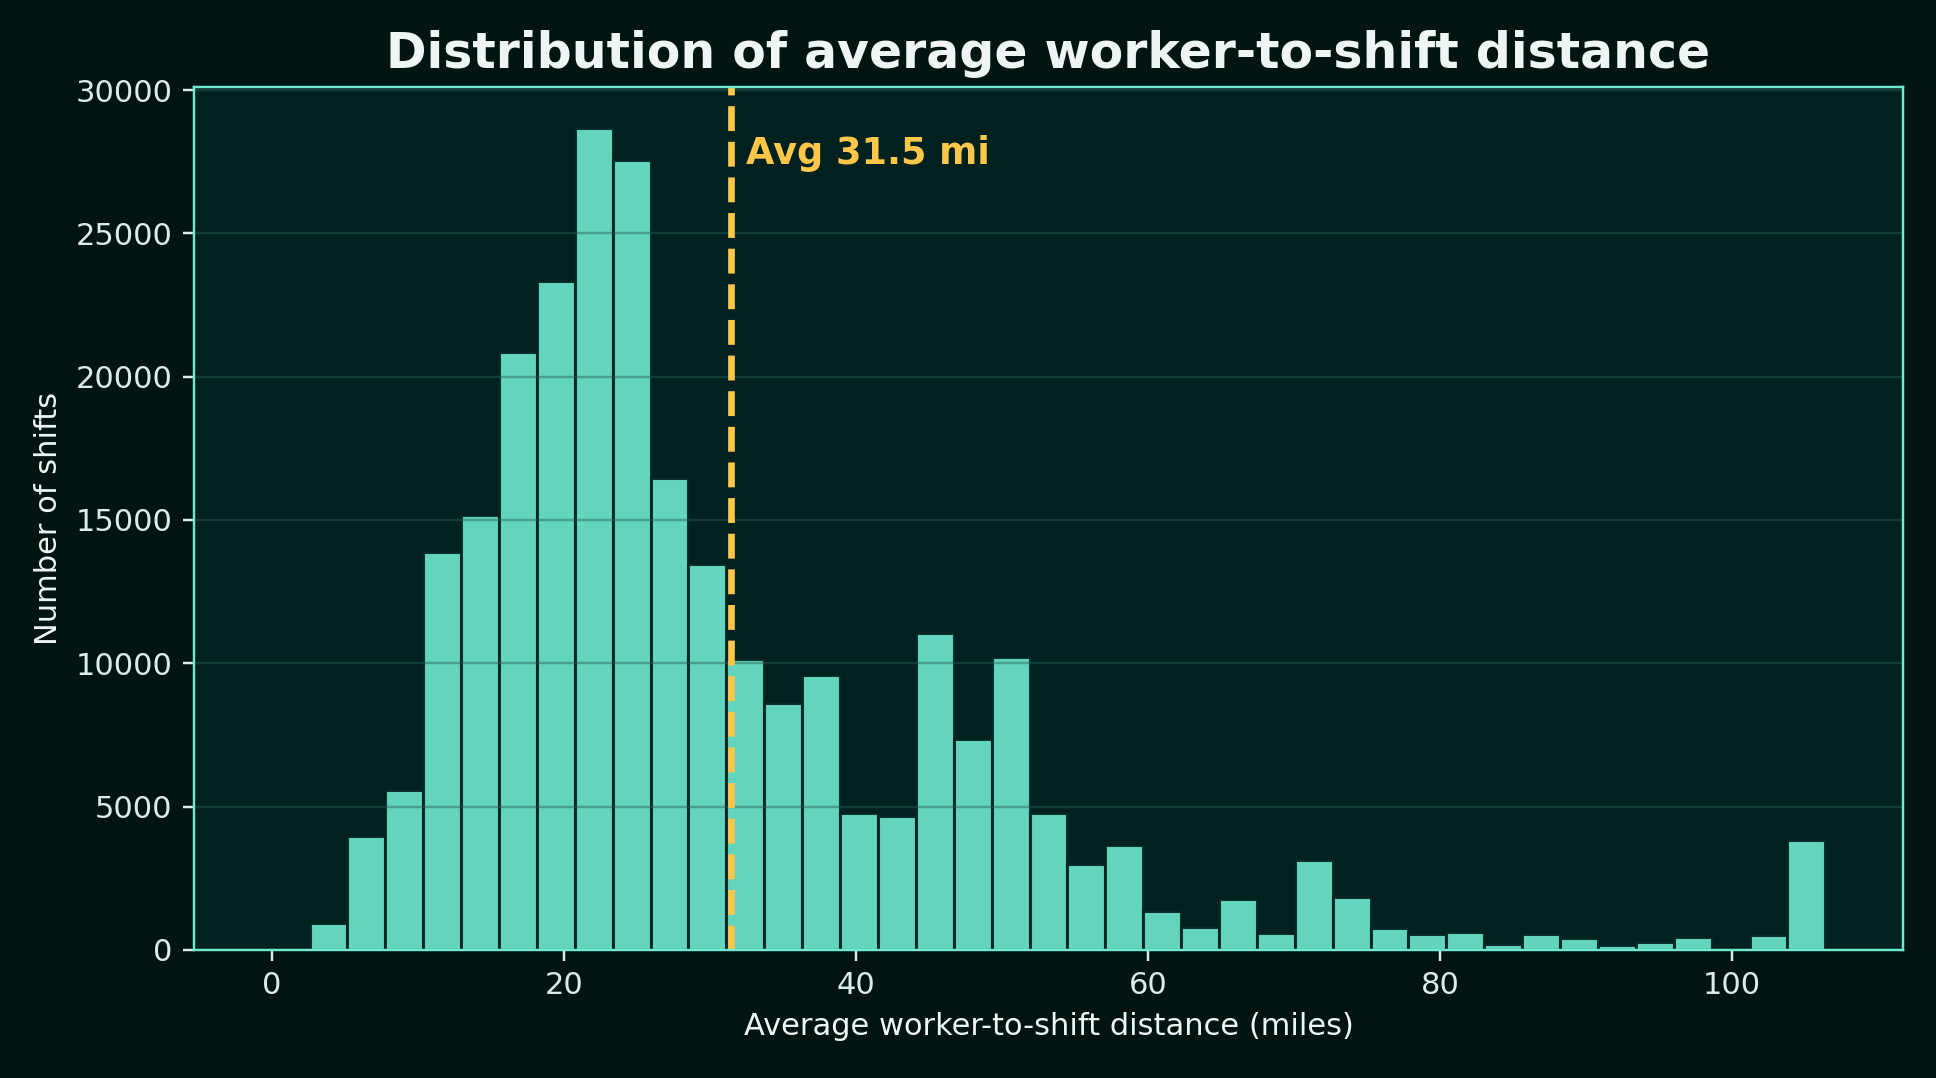
Figure 2: Distribution of average worker-to-shift distance across WorkWhile shifts. The dashed line marks the overall average of 31.5 miles.
To get a sense of the dollar amounts, take a worker driving the average 31.5 miles each way in a car that gets 25 miles per gallon. That's 63 miles and about 2.5 gallons per shift. At January prices, the round trip cost about $7. At May's peak it cost more than $11, and in September it was still nearly $11. For someone working several shifts a week, that adds up quickly.
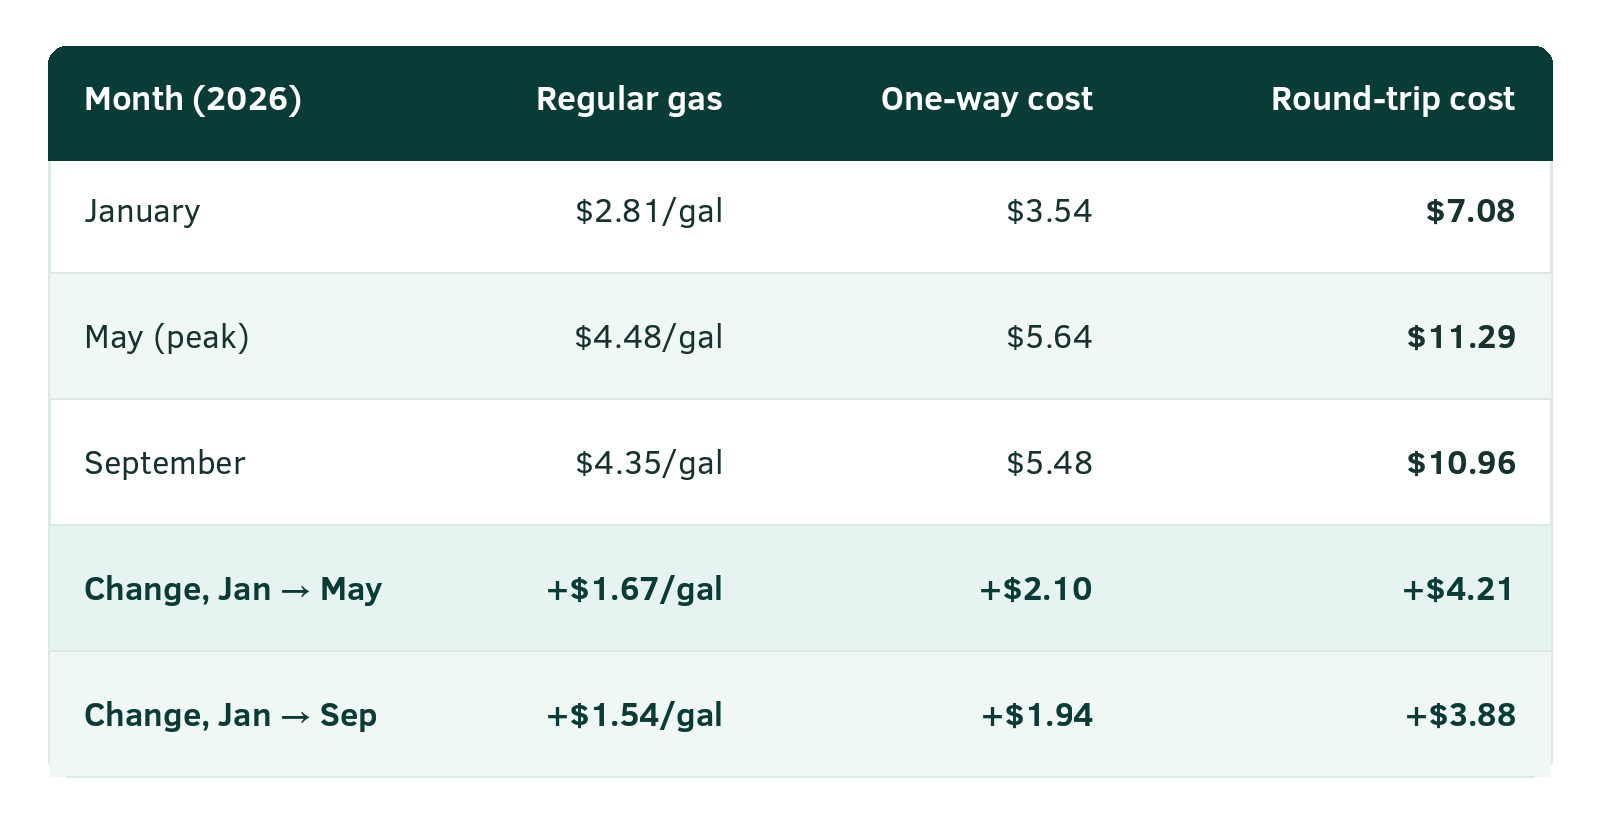
Table 1: Fuel cost of an average-distance commute. Assumes 31.5 miles one-way (63 miles round trip) at 25 MPG, priced at EIA monthly averages for regular gasoline.
How we measured it
We compared how distance related to shift outcomes before and after gas prices began rising in late January and early February 2026. Comparing the same kinds of shifts across that cutoff lets us ask whether a mile became more costly to the marketplace after fuel got more expensive.
We looked at two outcomes:
- Schedule fill rate: the share of requested worker slots on a shift that were actually filled.
- Bonus per completed worker: total bonus paid on a shift divided by the number of workers who completed it. Shifts with no bonus are included as zeros, so this reflects how incentive pay works across the whole market and not only on bonused shifts.
For each outcome, we estimated a regression in which distance is allowed to have a different effect after the cutoff:
y = β₀ + β₁·distance + β₂·post + β₃·(distance × post) + controls + fixed effects
Here β₁ is the effect of distance before the shock, and β₃ measures how much that effect changed afterward. We report everything per 10 additional miles. For fill rate, the units are percentage points: a value of −1.35 pp means a shift 10 miles farther away had a fill rate 1.35 percentage points lower, all else equal. For bonuses, the units are dollars per completed worker.
The fill-rate model controls for the bonus paid, base worker earnings, and the number of workers requested. Both models include market, month, and day-of-week fixed effects. We estimated the models separately for California delivery-type shifts and all other shifts, because these segments differ in labor market structure. Specifically, California delivery-type shifts receive Prop-22 guaranteed earnings, which provides for not only time-based pay but also mileage-based pay. This means that any dollar change in gas prices relative to base earnings for drivers of these shifts has a smaller percent impact on earnings in California than outside of it.
Finding 1: Distance got more expensive to fill, outside California delivery
For all other shifts, the distance penalty grew noticeably after the gas shock. Before the cutoff, each additional 10 miles was associated with a fill rate 1.35 percentage points lower. Afterward, the penalty was 1.67 points, a change of −0.32 points per 10 miles, which means the penalty became about a quarter steeper. A shift 30 miles past the average would now give up about one more point of fill rate than it did before the shock.
For California delivery-type shifts, the distance penalty hardly changed: −1.10 pp before and −1.13 pp after, a difference of just −0.03 points. This segment appears to have been largely insulated from the shock, and again, we consider Prop 22 guaranteed earnings as the likely explanation for this smaller effect.
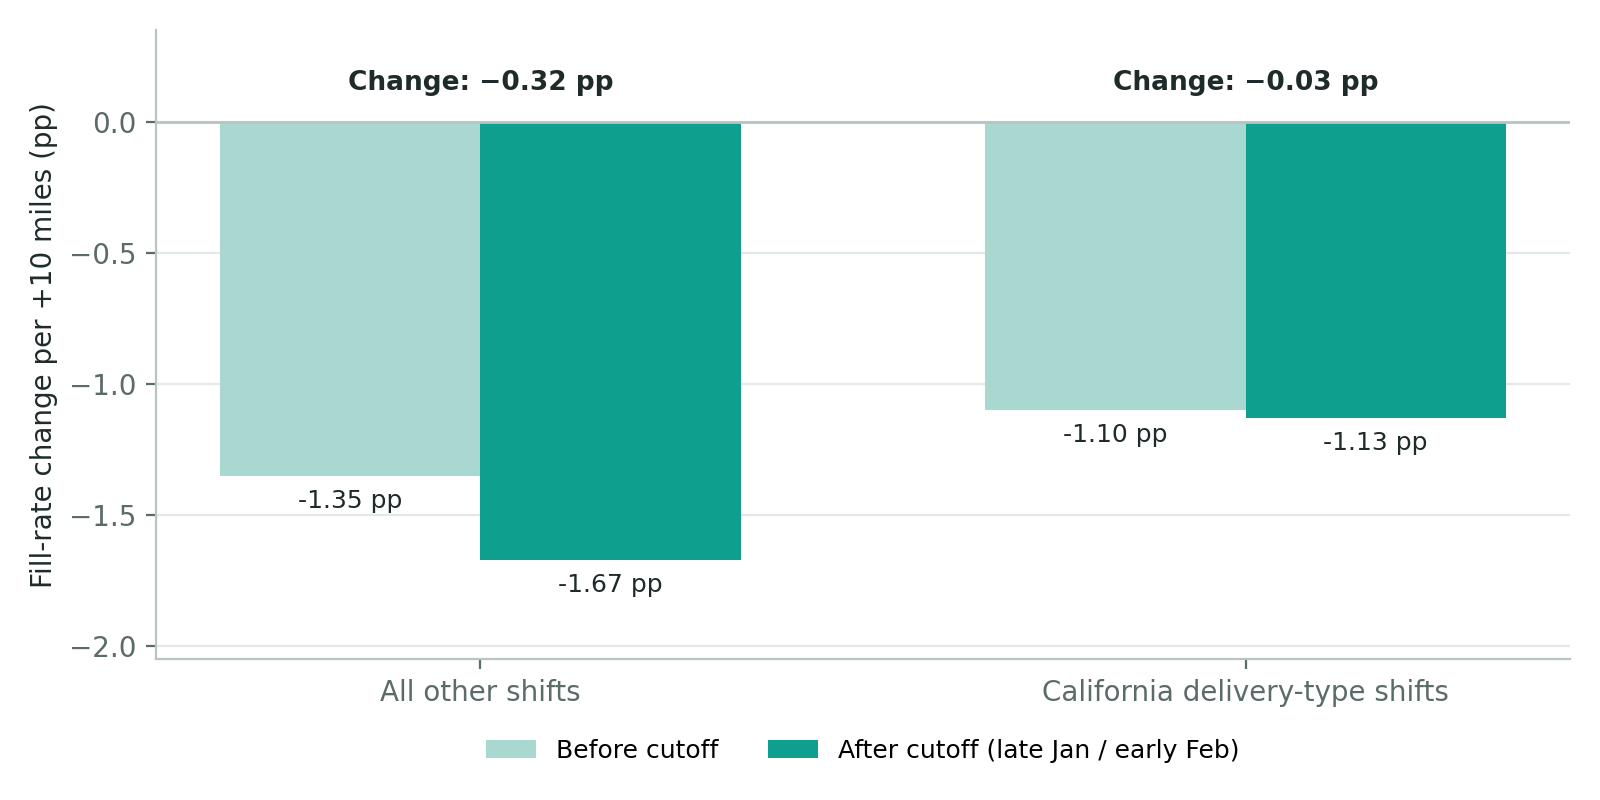
Figure 3: Change in schedule fill rate per additional 10 miles, before and after the gas-price cutoff. Estimates control for bonus paid, base earnings, workers requested, and market, month, and day-of-week fixed effects
Finding 2: Incentive pay didn't move
If the market were adjusting fully, bonuses for distant shifts would have risen as fuel became more expensive. They didn't. For all other shifts, farther shifts earned an extra $0.81 per completed worker per 10 miles, both before and after the cutoff. Incentive pay continued to recognize distance, but at exactly the same rate as before, even as the cost of driving went up sharply.
A simple calculation shows the size of the gap. An extra 10 miles each way adds 20 miles of driving, or 0.8 gallons at 25 MPG. In January that cost about $2.25. At May's peak it cost $3.58, and in September $3.48. The bonus for those 10 miles stayed at $0.81. Even before the shock, the distance bonus covered only about a third of the extra fuel cost. After the shock it covered less than a quarter.
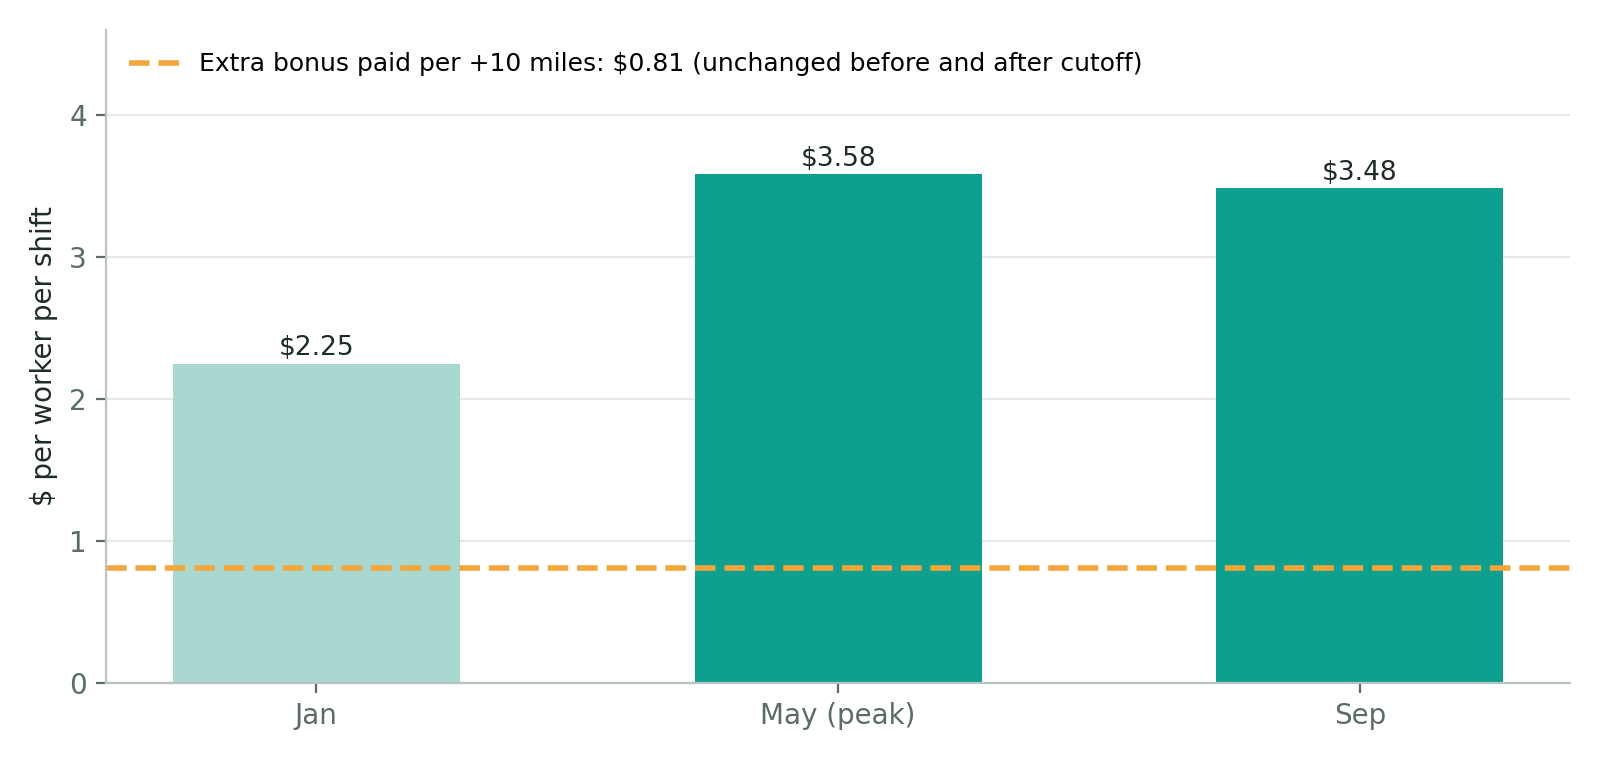
Figure 4: Fuel cost of an extra 10 miles each way vs. the extra bonus paid per 10 miles (all other shifts). Bars show 20 additional round-trip miles at 25 MPG, priced at EIA monthly averages. The dashed line shows the estimated bonus slope, which was the same before and after the cutoff. This is an illustrative comparison: the bonus slope is a conditional regression estimate, not a payment rule.
What this means for the frontline economy
Fuel prices act as a hidden wage cut, and distance determines who absorbs it. A headline hourly rate can stay the same while workers' net pay falls. The burden isn't spread evenly: it lands hardest on workers who live farther from where shifts are posted, often because housing near job centers costs more.
Incentive pay that doesn't respond to input costs leaves a gap the market has to fill another way. In this case, the gap showed up as lower fill rates on distant shifts. That is a cost for businesses that need those shifts covered and lost earnings for workers.
Shift-level data picks up these effects as they happen. National statistics record wages and fuel prices separately and with a lag. Platform data shows them interacting in workers' decisions, shift by shift, while the shock is still underway.
What this analysis doesn't (yet) capture
- One shock, one cutoff. The before/after design assumes nothing else changed systematically at the same time that would affect distant shifts differently. Seasonality is partly absorbed by month fixed effects, but other concurrent changes can't be fully ruled out.
- Average distance, assumed fuel economy. Distance is measured as average worker-to-shift distance, and the cost calculations assume 25 MPG. Actual routes, vehicles, and use of transit or carpooling vary.
- Fill rate is not the whole picture. Gas prices may also affect lateness, cancellations, or which workers choose to stay active on the platform, none of which are measured here.
Conclusion
The 2026 gas shock made every mile of a commute more expensive, and WorkWhile data shows the marketplace felt it. Outside California delivery-type work, distance became about a quarter more costly to fill after prices spiked, while the incentive pay attached to distance stayed the same. The effect is modest, not dramatic, but its direction is clear: when the cost of getting to work rises and pay doesn't adjust, distant shifts are the first to go unfilled.
With gas still about 55% above where it started the year, this is an ongoing issue for workers' take-home pay and for the businesses that depend on them showing up. Shift-level data lets us track it in real time.

